Friday, June 29, 2018

"What are the odds?" World Cup Teams Play Each Other Twice?

Note: the following has been reran and edited after reviewing my code and the answer from FiveThirtyEight. I've identified that I was only tracking about half of the results and thus my answer was roughly (incorrectly) cut in half. For example, I was not identifying [England vs Belgium] to be the same as [Belgium vs England]. 

This week's FiveThirtyEight Riddler asks the following question:
Assuming we don’t know anything about the strengths of the teams in the tournament, what are the chances that any pair of teams in a 32-team World Cup plays each other twice? (Given the way the World Cup bracket works, their first encounter would be in the round-robin, three-game group stage, with their second encounter in the final or the third-place game.) 
Extra credit: What would those chances have been given FiveThirtyEight’s pre-tournament odds for this year’s field?
Thanks to my pre-built World Cup simulator, it was pretty easy to adapt it to answer these questions. I set every team's strength equal and removed home field advantage (maybe this tournament is played on the moon) so that every single game is equal. After 100,000 simulations, the odds of having ANY two teams meet again in either the final and/or third place game is about 22% (this actually isn't too hard to calculate mathematically either; more on that later).

For the "extra credit" piece, I took FiveThirtyEight's pre-tournament rankings and ran them through my simulator as well. I used 0.5 goals for home field and an assumed standard deviation in scores of 1.62 (which appears to match FiveThirtyEight's assumptions after I fit my probability formulas against their output). Surprisingly, I actually got a different answer from them after 100,000 runs: 19.5%. I suspect my decreased likelihood is due to an assumption of more randomness in matches (thus decreasing the chance of the strongest teams meeting again).

The top frequencies of rematches (from before the start of the tournament) were as follows (with the top 5 outcomes still possible):


Team ATeam BFrequency% of Total
PortugalSpain444122.85%
BelgiumEngland258813.32%
ArgentinaCroatia18069.29%
BrazilSwitzerland17458.98%
RussiaUruguay10675.49%
GermanySweden10565.43%
FranceDenmark8324.28%
GermanyMexico7593.91%
BrazilSerbia7103.65%
SpainMorocco7013.61%

Now for the straight math answer. Since all opponents are exactly the same, you can assume any two teams make it out of the group, and all pairs of teams that advance have already played each other once in the round robin. 

So the only math you need to do is on the bracket. From there, every team has a 50% chance of winning each game, which means any one team has a 12.5% of making the final or third place game. You can fix one team on one side of the bracket, and just need the probability that their counterpart makes it, which is 12.5% as well. With both the championship and third place match possible, you have 2 chances, or 12.5% + 12.5%. But these two events can also happen at the same time if a rematch happens in the final AND the third place game: 25%*25%*50% = 3.125%. So you have to subtract that occurrence: 12.5% + 12.5% - 3.125% = 21.875%.

Simulating the 2018 Knockout Rounds of the World Cup

As I did before, I've taken a composite of 4 different rating systems to create my "MDS Ratings" to project the knockout rounds of the World Cup. I'm then running this rating system back through my World Cup simulator 10,000 times. The parameters of 0.5 goals for home-field for Russia and 1.83 as the standard deviation in score are the same as before.


GroupCountryMDS RatingQuartersSemisFinalChampion
AUruguay1.5844.27%16.42%5.85%2.45%
BPortugal1.8055.73%22.91%8.99%4.57%
CFrance2.2954.26%33.58%17.20%10.30%
DArgentina2.0945.74%27.09%12.58%6.78%
EBrazil2.7777.52%55.07%36.03%25.41%
FMexico1.4222.48%9.85%3.67%1.71%
GBelgium1.9770.41%28.44%13.72%7.48%
HJapan1.0229.59%6.64%1.96%0.79%
BSpain2.2563.55%43.22%28.53%14.67%
ARussia1.1536.45%20.49%10.67%4.01%
DCroatia1.4653.00%19.69%9.53%3.35%
CDenmark1.3547.00%16.60%7.64%2.35%
FSweden1.2947.77%19.53%7.55%2.33%
ESwitzerland1.4252.23%22.55%8.96%3.02%
HColombia1.6747.89%27.33%12.39%4.80%
GEngland1.7452.11%30.59%14.73%5.98%

As before the tournament, Brazil is heavily your projected champion. I'm guessing the main reason my projections are so down on Spain compared to places like FiveThirtyEight is how I'm accounting for home field for Russia. I have Russia at a 36% chance to beat Spain in the next match, whereas they have Russia as a heavy 22% underdog.

Monday, June 25, 2018

Expected # of Purchases to Complete the Panini World Cup Collection

The Panini World Cup sticker collection is popular every 4 years as fans try to collect all players, stadiums, teams, and more. This year's edition includes 682 stickers to collect, which prompts the question: just how many sticker packs do you probably need to buy in order to complete the set?

The initial book comes with 26 stickers and costs $2. After that, every pack of stickers comes with 5 each and costs $1. I make the following assumptions:

  • You don't trade any duplicates with other collectors, so the only avenue you have to get new cards is to buy more
  • You don't buy more than one book
  • The randomness of cards follows the discrete uniform distribution (every card is equally likely)
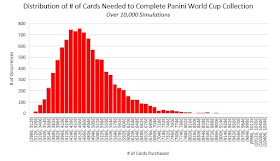
I ran 10,000 simulations to determine the expected number of purchases you would need to make to finish the book. In the median (most likely) case, you need 4,707 stickers to guarantee no duplicates. That's 1 book and 937 ticket packs, or $939 in cost.

Some additional metrics from the simulations:
  • Minimum to complete the book ("luckiest" trial): 2,986 stickers/1 book + 592 packs/$594
  • Maximum to complete the book ("unluckiest" trial): 10,513 stickers/1 book + 2,098 packs/$2,100
  • Average to complete the book (expected value, skewed by the extremes): 4,852 stickers/1 book + 966 packs/$968
The distribution is skewed right (see below), and since I'm using simulation, you can read the below percentages as "X% of the time I will complete the book in Y packs or less":


Tuesday, June 12, 2018

Simulating the 2018 World Cup

4 years ago I, like every other model, picked Brazil to win the World Cup on their home turf. It was my first attempt at a large scale simulator and took me over 1,500 lines of code, written in Java. But 4 years is a long time, I've switched to Python, and I can't even find what I wrote from back then.

So I've adapted my simulator, again, this time written in less than 300 lines, and using my own "ensemble model" like I've generated for college basketball.

I'm taking a composite of of 4 different rating systems, like Ed Feng does:

I used this model's output, along with the parameters of 0.5 goals for home-field for Russia and 1.83 as the standard deviation in score and simulated the World Cup 10,000 times to get the following probabilities:

GroupCountryMDS RatingAvg Points1st in Group2nd in GroupAdvanceQuartersSemisFinalChampion
AEgypt0.893.2110.45%19.39%29.84%9.11%3.01%0.84%0.22%
ARussia1.155.3239.02%33.68%72.70%33.78%15.95%6.46%2.48%
ASaudi Arabia0.593.4110.10%18.86%28.96%6.93%2.04%0.40%0.08%
AUruguay1.584.8540.43%28.07%68.50%30.82%14.42%5.67%2.17%
BIran0.972.926.44%15.22%21.66%9.10%2.87%0.81%0.18%
BMorocco1.133.219.16%19.22%28.38%12.74%4.48%1.30%0.40%
BSpain2.255.8858.18%24.70%82.88%57.53%34.64%18.61%9.92%
BPortugal1.804.8326.22%40.86%67.08%39.99%19.94%8.68%3.84%
CAustralia0.892.775.37%15.07%20.44%6.80%2.23%0.60%0.18%
CFrance2.296.1964.33%21.85%86.18%57.01%36.23%18.94%9.68%
CPeru1.363.9716.28%35.92%52.20%22.70%9.53%3.33%0.97%
CDenmark1.353.9114.02%27.16%41.18%17.75%7.53%2.85%0.86%
DIceland1.123.5011.93%22.34%34.27%12.32%4.84%1.60%0.56%
DNigeria0.963.117.73%17.37%25.10%8.36%3.05%0.90%0.28%
DCroatia1.464.3220.92%37.11%58.03%25.61%10.84%4.10%1.57%
DArgentina2.095.8759.42%23.18%82.60%49.45%28.40%14.03%7.23%
EBrazil2.776.9176.62%16.55%93.17%67.04%49.01%33.98%22.75%
ECosta Rica1.012.864.47%17.67%22.14%6.86%2.71%0.88%0.22%
ESerbia1.233.357.35%25.77%33.12%10.90%4.58%1.58%0.52%
ESwitzerland1.423.8011.56%40.01%51.57%18.05%8.04%3.22%1.18%
FGermany2.596.7273.37%17.57%90.94%62.00%44.14%29.77%17.82%
FSouth Korea0.802.543.92%13.76%17.68%4.34%1.42%0.41%0.08%
FSweden1.293.649.59%26.67%36.26%11.83%5.30%2.14%0.64%
FMexico1.424.0113.12%42.00%55.12%18.98%9.14%3.79%1.27%
GBelgium1.975.7755.04%27.21%82.25%51.91%23.26%12.62%5.88%
GPanama0.702.765.27%13.42%18.69%6.73%1.48%0.46%0.11%
GTunisia0.843.107.67%18.77%26.44%10.05%2.59%0.82%0.18%
GEngland1.745.2232.02%40.60%72.62%42.41%17.23%8.50%3.69%
HColombia1.675.1848.08%25.98%74.06%37.85%14.60%6.55%2.81%
HSenegal1.023.5211.37%19.24%30.61%11.11%3.20%0.93%0.36%
HJapan1.023.5513.88%21.65%35.53%12.71%3.47%1.06%0.36%
HPoland1.434.5326.67%33.13%59.80%27.23%9.83%4.17%1.51%

Brazil is your most likely champion, but so were they last time and we saw how that turned out.