Saturday, December 9, 2017

Points Per Minute Deficit (NCAAB)

As any diehard fan can tell you, when your team is down, you won't count them out until a comeback just isn't feasible anymore, models and simulations be damned. But there has to be some degree of reasonableness, right? 

Growing up a Carolina basketball fan, I always had certain heuristics in the back of my mind (instilled by my dad) on whether we could come back or not. The thinking went that if we could keep the score within the number of minutes left in the game, then we had a chance to chip away until we tied or took the lead at a rate of 1 point per minute. For example, if UNC trailed by 10 points with 9:50 left to play, then we needed to get to within 9 by 9:00 left to play. And then trail by 8 (or better) by 8:00 left, 7 by 7:00 left, etc. Note that this doesn't mean that the trailing team went on to win necessarily; all it means is that the trailing team either tied or took the lead at some point later in the game.

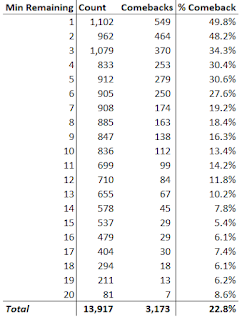
I aimed to determine if this heuristic had any basis in real-life results by looking at play-by-play NCAAB data for the entire 2016-17 season. I scraped KenPom's play-by-play win probability graphs to get scoring data on every possession, which ultimately gave me 393,719 individual possessions in 2nd half/overtime to analyze. Of those, 13,917 (3.5%) matched the criteria of being down x points with x minutes remaining.

There actually is a fairly linear relationship for this idea, with a largest deficit implying a lesser chance of a comeback (as you would expect):


Using linear regression, the relationship as shown above can be described as:

%_Comeback = -0.021*Min_Remaining + 0.409

This model has a fairly good fit too, with an r-squared value of 0.828.


For my purposes, I usually applied this thought process up until UNC trailed by 6 or less (a 2 possession game). At that point all you need is to make 2 threes and it's tied. However, based on the above graph it appears I should ONLY hold out hope when the deficit is within 2 possessions or less, since that is the only stretch in which the trailing team has better than a 1 in 4 chance of coming back. Good luck telling that to any fan of a team down by 7 or more though.

Friday, November 17, 2017

Free Throw % Splits Based on Shot Type

I've always been a solid free throw shooter: I shot 75% over 4,250 attempts during the insane three-year stretch where I tracked every single shot I took on the basketball court (and 85% over 630 attempts in 2016)). But when I played organized basketball when I was younger I would always brick free throws when I shot technical foul shots and was alone at the line (although never as badly as my intramural teammate who had an 0 for 34 stretch shooting free throws). Was this just an abnormal anecdotal observation, or does NBA play-by-play data back it up?

It's been previously established that free throw shooters improve from their first shot to their second/third. Nylon Calculus has a great database on this phenomenon from 1999-2016, and TrueHoop suggested in 2011 that the first attempt is like getting to practice free throws in the middle of the game. But what about other splits like when you're alone at the line, or when you can take only one shot (such as an and-1)?

I pulled down NBA play-by-play data for the full 2016-17 season from BigDataBall (a great source at a relatively cheap price for all play-by-play data back to 2006) and looked at every shot attempt and found the same thing previous studies had:


Free throw shooters get better on their second/third attempts, to a very high degree of statistical significance. Comparing the shooting percentage between the first vs second/third shot gives a z-score of 13.56, which has an associated p-value of 1. Even comparing first vs second attempts gives a z-score of 12.54, which has an associated p-value of 1 as well.

But what about my earlier considerations regarding being alone at the line (with no rebounders around you)? I looked at "normal" free throws (on an and-1, two-point shot, or three-point shot) compared with technical/flagrant/clear path foul shots where the shooter is "alone":


3% of all free throw attempts last season occurred where the shooter was "alone", and players shot significantly better in this case, going against my hypothesis. But these "alone" attempts include technical foul shots, which are taken by the best free throw shooter on the floor (the shooting team gets to choose who shoots them). If I remove technical foul shots I get a different picture:


picture that illustrates no significant difference in make percentage (z-score of 0.35 with an associated p-value of 0.64, which is inconclusive).

My final look focused on only the first free throw taken in a set: does the shooter perform better or worse if they know they're getting additional attempts? I.E. Is an and-1 different from the first shot from a set of 2 or 3 attempts?


As before, I filtered out technical shots, and as before, there's no significant difference (z-score of 0.29, p-value of 0.61).

All in all it seems my experience was abnormal: NBA free throw shooters do improve after their first attempt, but make their shots regardless of whether there are other players around them. This makes sense, since they are professional athletes and I am not.

Sunday, November 12, 2017

Whether Punt Returners Should Return Punts Inside Their Own 10 Yard Line (NCAAF)

A couple of years ago I wrote this post assessing whether a kick returner should return the kickoff out of the end zone, stemming from my frustration when a college kick returner chooses to forgo the free 25 yards and tries to be a hero and run the kick all the way back. I concluded that the risk/reward balance was actually fairly even when accounting for turnovers. So I now have a new source of frustration to investigate from a game theory perspective: whether punt returners should return punts from inside their own 10 yard line.

I've always thought that a standard unwritten rule for punt returners is to plant yourself at the 10 yard line and let anything kicked over your head go into the end zone. Instead, I've observed many a punt returner attempt to return it from inside their own 10 (UNC's own Ryan Switzer would notoriously make me irate doing this). Are they making a negative risk/reward decision or am I wrong in my steadfast belief that it's a bad decision?

I gathered three full seasons of play-by-play data, using 2011-2013 (since that's what was readily available from this great Reddit thread for NCAAF data). There were almost 15,000 punt returns over this stretch, of which 1,387 were inside the 10 (9.3%). Whittling it further, 669 were actually fair caught (48%), leaving me with 718 punt returns that were caught inside the 10 yard line and returned.

The average punt meeting this criteria was caught at the 7.36 yard line and was returned for 8.98 yards, thus bringing the ball out to the 16.34 yard line. 76% of the time the returner gained yardage, while 12% of the time the returner lost yardage (the other 12% resulted in no gain).

Of the 718 returns, 10 times the punt was ran back for a touchdown (1.4%). On the flip side, 30 returners fumbled and lost the fumble (4.2%), and an additional 2 returns resulted in a safety (0.3%). On its face, it appears my intuition is correct: it's way more risky to try to run it back. But which option is optimal? Return it, fair catch it, or let it bounce towards the end zone?

Sunday, October 22, 2017

Simulated World Series Preview 2017: LAD vs HOU

Over the course of my modeling career, I'm so far 0-2 when picking the World Series winners (I had KCR in 2014 and NYM in 2015). That's baseball for you, where the "favorite" only has about a 55% chance of winning a given 7 game series. This year's matchup features a matchup of two 100-win teams, the Dodgers and the Astros.

I've tweaked my simulator that I used in 2015 and simulated the World Series 10,000 times, and predict the Dodgers win it all in 6 games. So if you want to read too much into an extremely small sample size of 2014 and 2015, that means the Astros are winning it in 5 or 7.

My ratings are very in line with Baseball Prospectus, and have the two teams as fairly evenly matched:

LAD: 0.604

HOU: 0.592

So this series should go 6 or 7 games:


The pick: Los Angeles Dodgers in 6

Saturday, July 22, 2017

Preseason NCAAF Rankings for 2017

As I did last year, the year before, and the year before that, I've created a new set of preseason NCAAF rankings that take into account player turnover and recruiting classes. The following is literally copied and pasted from last year's write-up so you don't have to click that first link:

As before, I used my final Composite ratings from the MDS Model (from last season) as the base (which takes into account both a forward-looking predictive component and a past-performance only retrodictive component), and then factored in ESPN's Preseason FPI and the S&P+ projections, both of which take into account player changes on each team. Once the season starts, this "preseason" rating will be faded out as the season progresses, carrying less and less weight with each ensuing week.

In the below list, the "Trend" indicates whether the respective team's new ranking rose or fell relative to the average of last year's end-of-season Composite ratings. We have two new team's this year: Coastal Carolina (moving up from FCS) and UAB (welcome back!). 


RankTeamPRESEASONTrend
1Alabama0.924UP
2Ohio State0.863UP
3Oklahoma0.854DOWN
4Florida State0.841UP
5Clemson0.840DOWN
6LSU0.800UP
7USC0.770UP
8Michigan0.767DOWN
9Stanford0.761UP
10Washington0.744UP
11Notre Dame0.731DOWN
12Florida0.728UP
13Tennessee0.721DOWN
14Wisconsin0.715UP
15Auburn0.713UP
16Penn State0.711UP
17Ole Miss0.703DOWN
18TCU0.702UP
19Georgia0.701UP
20Louisville0.695UP
21Oklahoma State0.694DOWN
22Oregon0.684UP
23UCLA0.676DOWN
24Texas A&M0.668UP
25Baylor0.664DOWN
26North Carolina0.663DOWN
27Miami (FL)0.658UP
28Mississippi State0.647DOWN
29Arkansas0.643DOWN
30Michigan State0.638DOWN
31Texas0.634UP
32North Carolina State0.630UP
33Iowa0.629DOWN
34Washington State0.620UP
35Pittsburgh0.617DOWN
36Northwestern0.604UP
37Houston0.603DOWN
38Virginia Tech0.603UP
39Brigham Young0.601DOWN
40Boise State0.600DOWN
41Utah0.600DOWN
42Nebraska0.588DOWN
43South Florida0.586DOWN
44West Virginia0.582DOWN
45Memphis0.571DOWN
46Georgia Tech0.566UP
47Kansas State0.562UP
48San Diego State0.562DOWN
49Western Kentucky0.561DOWN
50Appalachian State0.556DOWN
51Toledo0.554DOWN
52California0.553DOWN
53Texas Tech0.553DOWN
54Arizona State0.553DOWN
55Navy0.542DOWN
56South Carolina0.541UP
57Temple0.528DOWN
58Arizona0.527DOWN
59Duke0.527UP
60Missouri0.526UP
61Minnesota0.525DOWN
62Indiana0.525UP
63Syracuse0.516UP
64Kentucky0.508UP
65Western Michigan0.506DOWN
66Vanderbilt0.504UP
67Colorado0.503UP
68Cincinnati0.484DOWN
69Iowa State0.476UP
70Wake Forest0.471UP
71Virginia0.462UP
72Colorado State0.461UP
73Tulsa0.460UP
74Southern Miss0.457DOWN
75Bowling Green0.456DOWN
76Boston College0.454UP
77Maryland0.454UP
78Oregon State0.451UP
79Utah State0.450DOWN
80Marshall0.448DOWN
81Arkansas State0.447DOWN
82Louisiana Tech0.447DOWN
83Central Michigan0.435DOWN
84Northern Illinois0.433DOWN
85Air Force0.426DOWN
86Illinois0.425DOWN
87Georgia Southern0.421DOWN
88Middle Tennessee0.417DOWN
89Troy0.405UP
90East Carolina0.402DOWN
91Ohio0.392DOWN
92Rutgers0.391DOWN
93Purdue0.390DOWN
94Southern Methodist0.384UP
95UCF0.365UP
96New Mexico0.365DOWN
97San Jose State0.358DOWN
98Nevada0.355DOWN
99Wyoming0.353UP
100Connecticut0.344DOWN
101Florida Atlantic0.343DOWN
102Ball State0.335UP
103Georgia State0.334DOWN
104Old Dominion0.332UP
105Miami (OH)0.332UP
106Akron0.328DOWN
107UTSA0.315UP
108Army0.311UP
109Louisiana-Lafayette0.311UP
110Tulane0.310UP
111Fresno State0.303UP
112Florida International0.300DOWN
113UNLV0.297UP
114South Alabama0.297UP
115Massachusetts0.293UP
116Eastern Michigan0.289UP
117Idaho0.286DOWN
118Kansas0.285UP
119Buffalo0.282DOWN
120Kent State0.275DOWN
121Hawaii0.270UP
122Rice0.270DOWN
123New Mexico State0.265UP
124North Texas0.244UP
125UTEP0.234DOWN
126Louisiana-Monroe0.230UP
127Texas State0.205DOWN
128Coastal Carolina0.196UP
129Charlotte0.193UP
130UAB0.130UP