Growing up a Carolina basketball fan, I always had certain heuristics in the back of my mind (instilled by my dad) on whether we could come back or not. The thinking went that if we could keep the score within the number of minutes left in the game, then we had a chance to chip away until we tied or took the lead at a rate of 1 point per minute. For example, if UNC trailed by 10 points with 9:50 left to play, then we needed to get to within 9 by 9:00 left to play. And then trail by 8 (or better) by 8:00 left, 7 by 7:00 left, etc. Note that this doesn't mean that the trailing team went on to win necessarily; all it means is that the trailing team either tied or took the lead at some point later in the game.
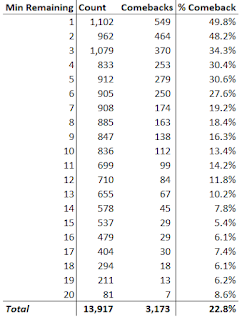
I aimed to determine if this heuristic had any basis in real-life results by looking at play-by-play NCAAB data for the entire 2016-17 season. I scraped KenPom's play-by-play win probability graphs to get scoring data on every possession, which ultimately gave me 393,719 individual possessions in 2nd half/overtime to analyze. Of those, 13,917 (3.5%) matched the criteria of being down x points with x minutes remaining.
There actually is a fairly linear relationship for this idea, with a largest deficit implying a lesser chance of a comeback (as you would expect):
Using linear regression, the relationship as shown above can be described as:
%_Comeback = -0.021*Min_Remaining + 0.409
This model has a fairly good fit too, with an r-squared value of 0.828.
For my purposes, I usually applied this thought process up until UNC trailed by 6 or less (a 2 possession game). At that point all you need is to make 2 threes and it's tied. However, based on the above graph it appears I should ONLY hold out hope when the deficit is within 2 possessions or less, since that is the only stretch in which the trailing team has better than a 1 in 4 chance of coming back. Good luck telling that to any fan of a team down by 7 or more though.


