Categories

Showing posts with label economics. Show all posts

Saturday, August 7, 2021

Cost Benefit of SodaStream Over Canned Sparkling Water

Note: This is NOT paid content for SodaStream... or Spindrift... or Sparkling Ice...

First we determined Lime is the best Spindrift flavor. Then we determined Black Cherry is the best Sparkling Ice flavor.

Now I'm going to illustrate why you should purchase none of these things, and get a SodaStream instead.

At the request of avid sparking water drinkers, I've been tasked with comparing the variable per unit cost of a drink from a SodaStream machine, vs purchasing canned sparkling water in bulk. So I tracked every one of my uses of a brand new SodaStream CO2 canister, until it went flat.

I tracked the number of drinks made, not the number of drinks actually consumed; just like if a can is opened and not finished, that can is still used.

Over 4 months, I got 63 uses out of 1 CO2 canister, which yielded 162 drinks. I can buy each replacement canister for $15 each. Since we're only considering the marginal variable cost, I'm treating the initial SodaStream cost as a fixed sunk cost.

If you want any flavor, we also have to consider something like Bubly drops (~3 bottles of drops would last an entire CO2 canister, which adds $15.33). Or, super bourgeoise, a fresh lime for each use - with a median of 3 drinks per SodaStream use, that's 54 limes at $0.50 each = +$27.

Our alternatives range from Costco brand sparkling water (Kirkland), LaCroix, Sparkling Ice, to Spindrift.

All fall to the SodaStream! Even when using fresh produce each time:

BrandTotalCostCostPerDrink
SodaStream$14.99$0.09
SodaStream w/ Drops$30.32$0.19
SodaStream w/ Limes$41.99$0.26
Kirkland$9.83$0.28
LaCroix$10.99$0.46
Spindrift$17.04$0.57
Sparkling Ice$9.98$0.83

Some more descriptive statistics:

Avg PumpsAvg DrinksPumpPerDrinkUses# Drinks
4.162.571.6263162

Thursday, June 20, 2019

Competitive Balance in MLB, NBA, NFL, and NHL

In light of the end of this year's NBA and NHL postseasons, both Finals in each sport had a team that seems to be there almost every year (Golden State in NBA and Boston in NHL). Which begs the question: are both sports devoid of competitive balance (CB)? Especially in relation to the other 2 major pro sports leagues in North America, MLB and NFL?

I've measured CB before in NCAAB and the NBA, but haven't compared the leagues against eachother. So I've compiled all semifinalists over the past 10 years in each league, and calculated the Herfindahl–Hirschman Index (HHI), which measures CB. In this case, it is the sum of the squares of the number of semifinal (conference championship) appearances by team i (f_i) during the designated period, over the number of possible semifinalists during the period. To account for the fact that there are 4 teams that are semifinalists each year, we include a multiplier of 4 in the summation.


The closer HHI is to 1, the less CB there is in the league. Complete CB (4 different teams every single year) would be 0.1.

League# of Dif TeamsHHI
NHL200.265
MLB170.29
NBA180.315
NFL210.315

NHL has the most competitive balance over the last decade! At least in the conference finals. NBA and NFL are actually both tied for the least amount of CB. The NFL is very much weighed down by the Patriots, who have made 8 of the last 10 conference title games.

What if we just look at the final round of each league? 

League# of Dif TeamsHHI
NHL140.18
MLB130.18
NFL130.23
NBA90.33

NHL and MLB are tied, and unsurprisingly, the NBA is by FAR the least balanced (Warriors/Cavs/Heat/Spurs account for 75% (!!!) of the Finals appearances over the last 10 years). Similarly, the Patriots account for half of the Super Bowl appearances over the last decade.

This raises another question: is there any correlation in CB and the salary cap structure of each league? NFL and NHL are hard caps (you literally can't go over the cap), and that appears to exhibit mixed results (primarily due to the Patriots). MLB and NBA have soft caps (you can go over the cap, but you get penalized via escalating taxes for doing so), but MLB has a much softer cap than NBA (less severe penalties). So the CB between the two appears to be more influenced by the structure of their respective playoff rounds and the games themselves (baseball has shorter series and more volatility game-to-game).


Friday, December 21, 2018

Kia Soul Fuel Efficiency on ECO Mode

My 2015 Kia Soul has an "eco mode", which supposedly "helps the models to achieve a higher level of fuel economy by adjusting the engine and transaxle operating parameters". I usually have left it on since I drive quite a bit, with a 47-mile one way commute (94 miles round trip daily). Thing is, I have had no idea whether it actually does anything. It certainly makes changing gears slower, which makes it way harder to accelerate and sometimes feels like I'm driving a golf cart. Which certainly isn't ideal when I'm predominately driving on highways.

So over the past 3 months, I've started tracking splits of my mileage, gas fill ups, etc based on whether I have the "eco" button ON or OFF. Over a full timetable of 7,685 miles driven over 20 fill ups since 9/17/18, I've experienced the following performance per fill up:


EcoMiles DrivenGalMPGCount
ON348.012.3128.2810
OFF351.112.6527.7710
Total349.612.4828.0220

So the eco mode actually does have an effect! My fuel efficiency is about
0.51 miles per gallon better when I have eco mode turned on. 

The car also gives an "estimated" range every time I fill it up, and these "estimates" certainly don't reflect what my tracking has shown me, skewing high in both cases and also a much smaller predicated delta between ON/OFF (0.18 miles per gallon):


EcoEst RangeGalEst MPGCount
ON354.112.3128.7710
OFF361.612.6528.5910
Total357.812.4828.6820

So how much am I actually saving? Is it worth feeling like I need to start pedaling like Fred Flintstone in order to squeeze out another 0.51 miles per gallon? The current average gas price in Miami is around $2.35 per gallon, but over the course of my tracking I've been spending closer to $2.64 per gallon. So my savings would be:

0.51 miles per gallon * $2.64 per gallon * 1.56 savings per week = $2.10 per week

Is it worth ~$2 a week, or ~$104 a year, for a worse driving experience? Considering that I'm driving almost 100 miles round trip each day, 5 days a week, I think I'll leave eco mode OFF going forward.

Friday, September 21, 2018

Le'Veon Bell is Costing Fantasy Owners More Than His Salary

Le'Veon Bell is currently giving up $853k a week to hold out for a better deal from either the Steelers or another team in free agency next season. That's a lot of money, and with the stalemate growing more contentious and extending past Week 3 at this point, it seems likely he will remain out until Week 11, "when he must report in order to ultimately reach free agency" (per the Washington Post).

Le'Veon Bell is also currently one of the best fantasy football players in the game. He was a consensus top 3 pick until the contract situation really started threatening his likelihood to play, after which he started sliding down draft boards:


With fantasy sports being a $7 billion industry, his holdout on the field is certainly impacting real money off the field. So I was posed this question: is Bell costing his fantasy owners more money than he is himself?

The first step towards answering this is determining how much money is really on the table in traditional fantasy football leagues. I compiled a litany of overall stats on the fantasy industry from the Fantasy Sports Trade Association:

  • 59.3 million users play fantasy sports (note that 1 person can play multiple sports)
  • 19 million users play fantasy football (32% of all users)
  • $184 is the average amount spent annually on "traditional fantasy sports", i.e. non-DFS
  • 70% of players pay a league fee
From the above figures I was able to derive a lot, along with some other assumptions. The median football league contains 12 players (the average should be slightly higher due to larger leagues skewing the mean), so I estimate there are about 1.36 million fantasy football leagues out there. Of these, 70% have a league fee, so there are 950k (1.36m * .7) paid leagues.

If the average spend is $184 per player, and 32% of players are playing football, then I'm assuming $59 ($184 * .32) is the average spend on fantasy football leagues. This may seem high since most leagues are a $20 buy-in, but this number will be skewed higher by high rollers playing in leagues that have buy-ins of $1,000+.

This means that the typical league pot is $707 ($59 * 12), resulting in $672.1 million ($707 * 950k paid leagues) being in play across all leagues. But how much is Bell's absence directly costing fantasy players? I'll need to calculate the impact in expected winnings on a team that drafted Bell with a top 3 pick, but has to use a replacement level "third best" RB instead (since 2 running backs start in a typical 12 team PPR league).

First, the expected value of a team in the playoffs: in a 12 team league, I'm assuming 4 teams make the playoffs, and are evenly matched at that point such that each team has a 25% chance to come in 1st/2nd/3rd/4th. A typical payout structure is 60%/30%/10% for 1st/2nd/3rd, so the $707 pot would be split $424/$212/$71. If each spot is equally likely (once you're in the playoffs), the expected value of winnings is $177 ($424 * .25 + $212 * .25 + $71 * .25).

Now I need to simulate the difference between a team without Bell (and a third string replacement) versus an "average" team, and how that affects their chances of making the playoffs.

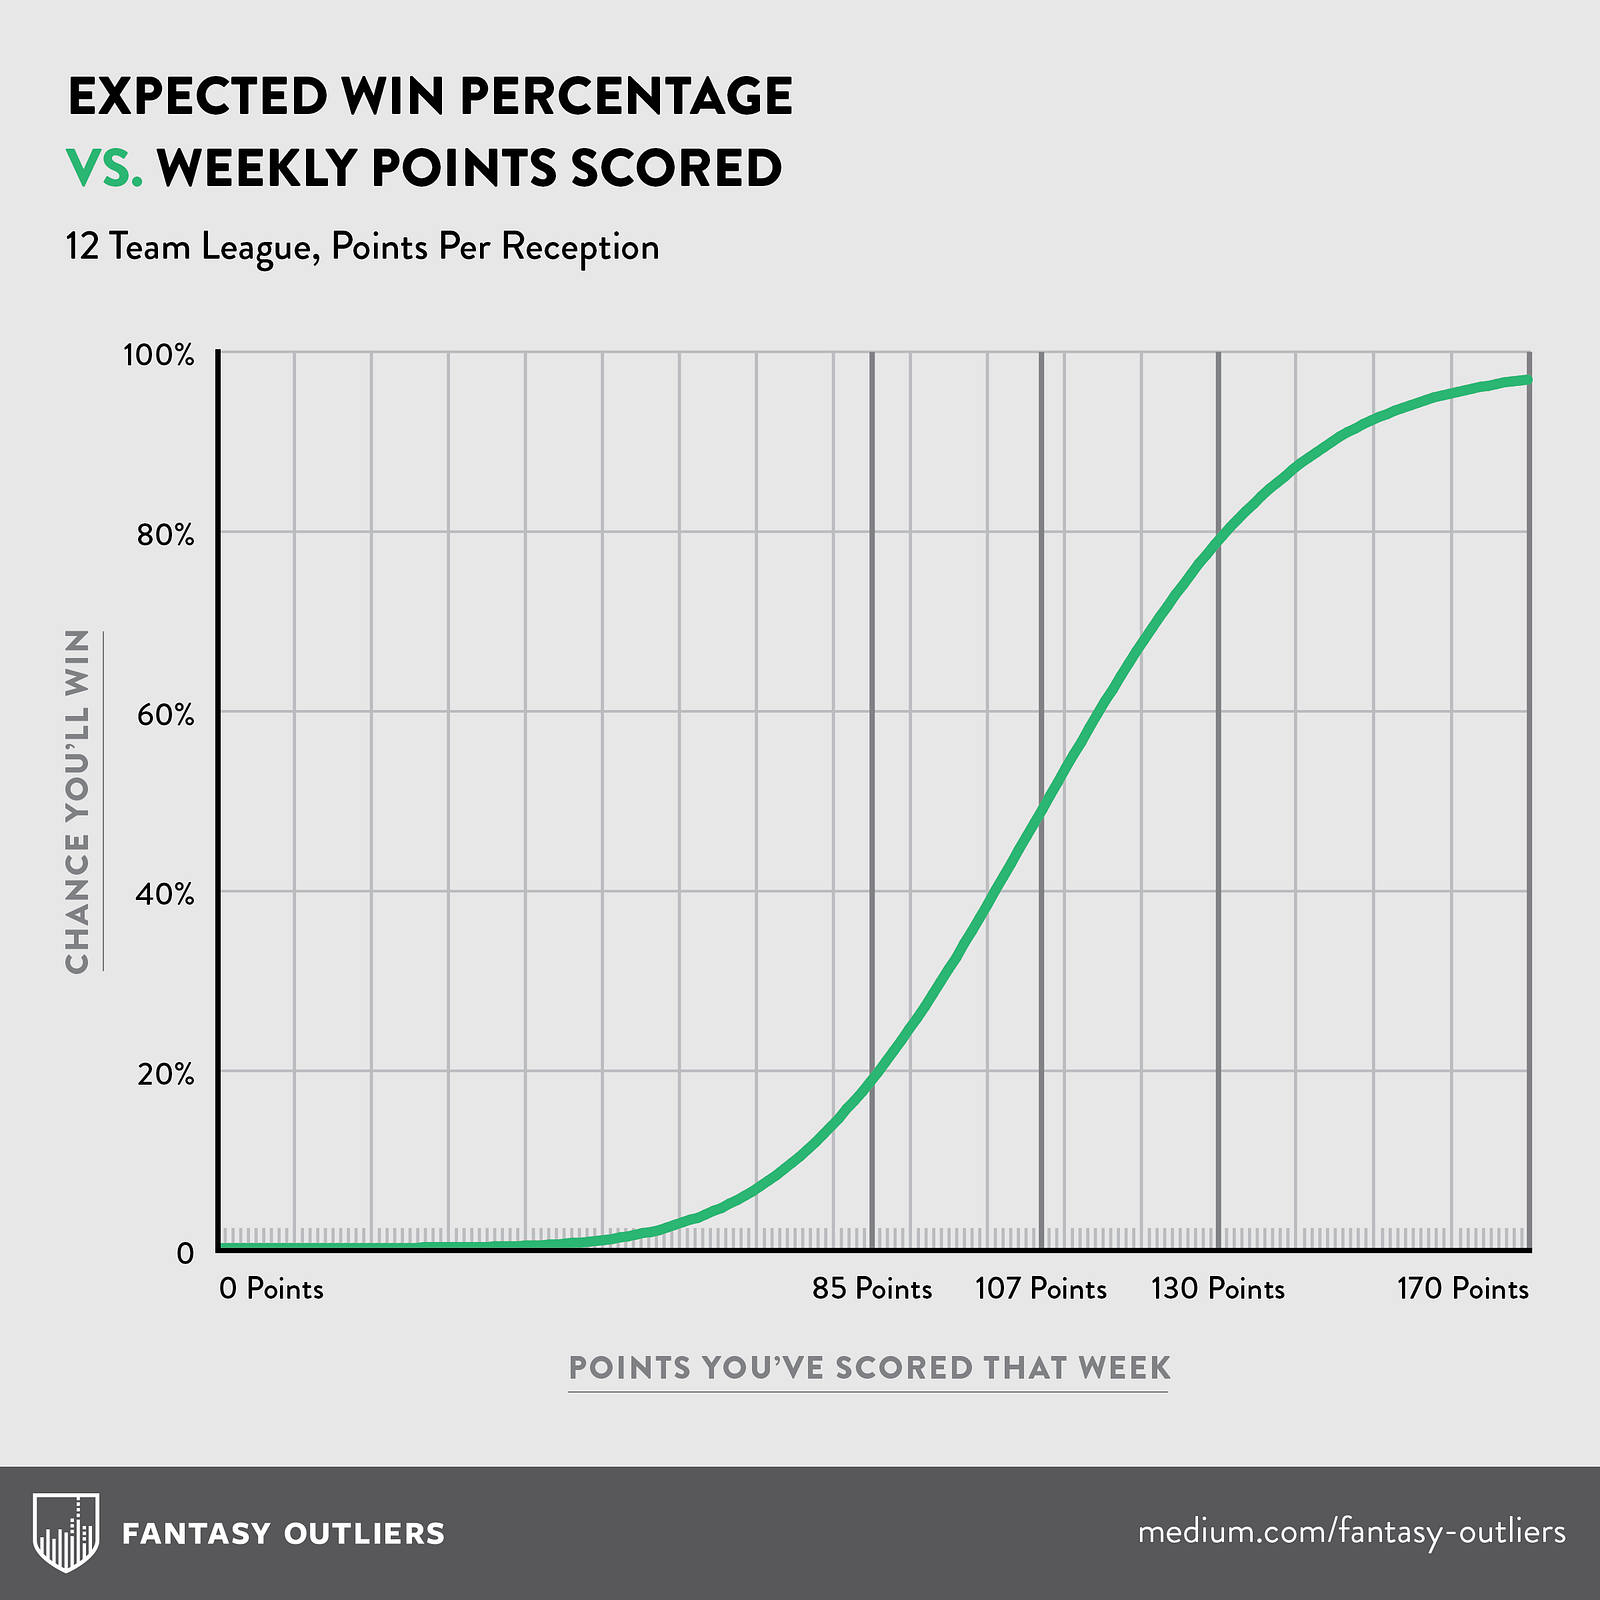
Over the past two seasons, Bell has been the best running back in fantasy, averaging 22.6 points per game. Meanwhile, the replacement level third string RB taken much later (the 40th ranked RB or so) only will score around 5.3 points per game. That results in a delta of 17.3 points per game, which is a massive gulf to fill. The difference between a 50th percentile team and a 25th percentile team is only 16 points per game! So if you were average with Bell, you would drop to the 23.3 percentile without him. In turn, your odds of winning each week drop by a ton, to around 25%:


So I simulated two different seasons 10,000 times each: one in which Bell is AWOL for the first 10 weeks of the season, and one in which you (and everyone else) each have an average team all year long. You need at minimum 8 wins to make the playoffs, and you can only expect around 4 without Bell:


In the Bell-less scenario, you would be missing out on 17.3 points for the first 9 weeks of the season, and your chances of making the playoffs are 3.9% per the simulationsNow compare this to an "average" league with your "average" team - you should have a 4/12 chance (33.3%) of making the playoffs, and the simulations more or less back this up, projecting a 31.9% chance your "average" team makes the playoffs.

The final piece here is how much money this drop in playoff odds is costing you. The sum in expected values once in the playoffs is $168 million (950k leagues * $177 expected value in playoffs). Without Bell and a 3.9% chance of making the playoffs, the total expected value is $6.55 million (0.039 * $168 million). With Bell and a 31.9% chance of making the playoffs, the total expected value of an average team is $53.6 million. The difference between those two? $47.05 million, or $4.705 million per week that Bell misses, which completely dwarfs the $853k that Bell is foregoing each week he doesn't play.

Saturday, August 4, 2018

Deviating From Basic Strategy: Alternate Scenarios (Blackjack)

In my previous post, I looked at whether playing the "wrong" strategy at a blackjack table really affects the other players at the table. I looked at a handful of different "bad" strategies, but in all cases I looked at the fairly standard scenario of 5 players at an 8 deck table. As before, I've used Wizard of Odds' house edge calculator to make sure the simulator is aligned.

I'm using the following house rules, with the only changes being the number of decks and the number of players at the table:

  • 3 to 2 blackjack/no surrender/dealer hits on soft 17/double after split/split up to 4 hands/resplit aces/can not hit split aces
There are a lot of scenarios below, so here's a quick table of contents:
  • 8 decks, 5 players with a "cautious" player who only slightly deviates from basic strategy
  • 8 decks, 2 players, all deviating strategies
  • 2 decks, 5 players, all deviating strategies
  • 2 decks, 2 players, all deviating strategies
As before, all results are over 100,000 hands. First, I was asked to run the same scenario as last time (8 decks/5 players), but with the deviating player only making a slight tweak to basic strategy by staying on 15 and 16 no matter what (like you often see at a real table). I'm calling this the "cautious" strategy.

One Player Plays "Cautious" Strategy

Remember that the house edge should be around -0.5988%. In the middle of the table this "cautious" strategy marginally hurts that player, dropping their house edge to -0.6443%. Everyone else doesn't change at all, with an edge of -0.5940%

At third base, this strategy hurts about the same to the "cautious" player, to the tune of -0.6464%. And it does inflict damage on everyone else, barely, to -0.6231% (barely crossing the threshold of rejecting the null hypothesis with a p-value of 0.0096). So in the end, the "cautious" approach certainly doesn't merit the verbal abuse that other players often inflict on someone playing that way when they stay on 15 or 16.

Erratic Player at Seat 3
8 Decks, 5 Players
Seat NumberStrategyHouse EdgeP-Value$ Cost vs Base
1, 2, 3, 4, 5Basic-0.5988%0.500$0.00
1, 2, 4, 5Basic-0.5940%0.601$0.00
3Cautious on 15/16-0.6443%0.008-$10.22
Erratic Player at Seat 5 ("Third Base")
8 Decks, 5 Players
Seat NumberStrategyHouse EdgeP-Value$ Cost vs Base
1, 2, 3, 4, 5Basic-0.5988%0.500$0.00
1, 2, 4, 5Basic-0.6231%0.100-$5.46
5Cautious on 15/16-0.6464%0.006-$10.71

Saturday, July 14, 2018

Deviating From Basic Strategy's Effect on Other Players (Blackjack)

It's a very commonly held belief among blackjack players that someone else at the table playing the "wrong" strategy will negatively everyone else playing the "correct" basic strategy. I will go on record that I agree with this hypothesis - by deviating from basic strategy (which tells you explicitly what to do in each situation to minimize the house edge), are you not affecting both the hands of the players around you and that of the dealer? All hands are certainly correlated, since there is only one shared shoe of cards to draw from. The question is: does someone playing erratically actually matter enough to cost everyone else?

I've written multiple blackjack simulators in the past, but this time I adapted a very well-written simulator in Python to test this hypothesis. I coded the computer to play total dependent basic strategy and then ran a multitude of different scenarios. In all cases, the computer players are very different from human players in that:

1. They don't make mistakes and play exactly as they're programmed
2. They don't ever tilt

3. They don't ever get tired or indulge in one too many comps

All Players Play Basic Strategy

To test the validity of the simulator, I ran the scenario in which there are 5 players at the table, and all of them are playing basic strategy like they're supposed to. I'm not assuming they're playing at a great locals casino (shout out to Red Rock!), so the table rules I input are fairly standard for what you'll find on the Las Vegas strip these days, except I made the blackjack payout 3 to 2: 

  • 8 deck/3 to 2 blackjack/no surrender/dealer hits on soft 17/double after split/split up to 4 hands/resplit aces/can not hit split aces

The house edge should be 0.59109%, as determined by Wizard of Odds' house edge calculator. After 100,000 hands, the 5 players experienced a house edge of 0.5988%, meaning the simulator is pretty well aligned. I will use this number as my base case for all other scenarios.

One Player Plays "Never Bust" Strategy

In this scenario, one player never hits a hard 12 or more (so they never bust). I assumed this player would sit in the middle of the table (seat 3). This strategy hurts them, but not anyone else at the table: their house edge is -1.0086%, while everyone else at the table incurs -0.5915% - essentially the same as if all players played basic strategy.

What if this player was at "third base", so their decisions have an increased effect on the dealer's hand? In this case they have a similar house edge: -1.0038%, but everyone else falls to -0.6542%. This is statistically significant with a p-value of 0.9983 compared to our base case. With 5 players, a typical dealer targets 75 hands per hour. So for a player playing $100 a hand for 3 hours, this is expected to cost them $12.46 vs the base case. Over time this certainly can add up.

One Player Plays "Mimic the Dealer" Strategy

In this scenario, one player plays exactly like the dealer does. When the player is in seat 3, the strategy hurts them, but not anyone else at the table: their edge is -1.4427% and everyone else's is -0.6060%.

At third base, the story changes again: their house edge is similar at -1.5655%, while everyone else's is -0.6634%. Check the tables at the bottom for a breakdown of statistical significance and the expected negative cost to a typical basic strategy player (this result is both statistically significant and costly).

One Player Plays "Assume a Ten in the Hole" Strategy

In this scenario, one player assumes the dealer's hole card is always a ten. This is the worst of the "wrong" strategies I tried out by far: at seat 3, their edge is -1.8129% and everyone else's is -0.6042%.

At third base, this player has an effect on the table once more: their edge is equally bad at -1.8315%, while everyone else drops to -0.6312%.

One Player Is Drunk and Acts Completely Randomly

This is my favorite real life scenario: one of the other players plays completely randomly, hitting/staying as if they were flipping a coin, and occasionally doing something insane like splitting 5s or splitting 10s (both of which I've seen happen in real life). This is the worst case for that player: they have an edge of -3.6333%, but everyone else is relatively unaffected at -0.5952%

If they're at third base though... then everyone gets hurt. They have an edge of -3.5964% and everyone else falls to -0.6327%.

Conclusion

In the most likely scenario, where someone sits down randomly and doesn't play basic strategy, I was wrong: they don't have a significant effect on everyone else at the table. But when they're at third base, they do: barely, costing a $100/hand bettor $7-$15 over the course of 3 hours. Definitely not enough to merit a full blown meltdown and confrontation like I've seen happen at the tables. So if this happens to you, or someone else at your table? Ignore it, or just move tables. It's all a negative expected value in the end anyway (unless you're counting...).

In a future post I aim to look at how changing the number of people or the number of decks affects the house's edge. Here are the summarized results for the scenarios I've looked at thus far, under the following assumptions:

  • Rules: 8 deck/3 to 2 blackjack/no surrender/dealer hits on soft 17/double after split/split up to 4 hands/resplit aces/can not hit split aces
  • 5 players
  • Results with alpha <= 0.1 were considered (very liberal test of significance)
  • The $ Cost vs Base Case (where everyone plays basic strategy) is calculated for a player playing $100 per hand, 75 hands per hour, over 3 hours
Erratic Player at Seat 3
Seat NumberStrategyHouse EdgeP-Value$ Cost vs Base
1, 2, 3, 4, 5Basic-0.5988%0.500$0.00
1, 2, 4, 5Basic-0.5915%0.650$0.00
3Never Bust-1.0086%0.000-$92.20
1, 2, 4, 5Basic-0.6060%0.352$0.00
3Mimic-1.4427%0.000-$189.88
1, 2, 4, 5Basic-0.6042%0.387$0.00
3Assume 10-1.8129%0.000-$273.16
1, 2, 4, 5Basic-0.5952%0.575$0.00
3Drunk-3.6333%0.000-$682.75

Erratic Player at Seat 5 ("Third Base")
Seat NumberStrategyHouse EdgeP-Value$ Cost vs Base
1, 2, 3, 4, 5Basic-0.5988%0.500$0.00
1, 2, 3, 4Basic-0.6542%0.002-$12.46
5Never Bust-1.0038%0.000-$91.12
1, 2, 3, 4Basic-0.6634%0.000-$14.54
5Mimic-1.5655%0.000-$217.49
1, 2, 3, 4Basic-0.6312%0.043-$7.28
5Assume 10-1.8315%0.000-$277.36
1, 2, 3, 4Basic-0.6327%0.037-$7.63
5Drunk-3.5964%0.000-$674.45