Categories

Friday, December 21, 2018

Kia Soul Fuel Efficiency on ECO Mode

My 2015 Kia Soul has an "eco mode", which supposedly "helps the models to achieve a higher level of fuel economy by adjusting the engine and transaxle operating parameters". I usually have left it on since I drive quite a bit, with a 47-mile one way commute (94 miles round trip daily). Thing is, I have had no idea whether it actually does anything. It certainly makes changing gears slower, which makes it way harder to accelerate and sometimes feels like I'm driving a golf cart. Which certainly isn't ideal when I'm predominately driving on highways.

So over the past 3 months, I've started tracking splits of my mileage, gas fill ups, etc based on whether I have the "eco" button ON or OFF. Over a full timetable of 7,685 miles driven over 20 fill ups since 9/17/18, I've experienced the following performance per fill up:


EcoMiles DrivenGalMPGCount
ON348.012.3128.2810
OFF351.112.6527.7710
Total349.612.4828.0220

So the eco mode actually does have an effect! My fuel efficiency is about
0.51 miles per gallon better when I have eco mode turned on. 

The car also gives an "estimated" range every time I fill it up, and these "estimates" certainly don't reflect what my tracking has shown me, skewing high in both cases and also a much smaller predicated delta between ON/OFF (0.18 miles per gallon):


EcoEst RangeGalEst MPGCount
ON354.112.3128.7710
OFF361.612.6528.5910
Total357.812.4828.6820

So how much am I actually saving? Is it worth feeling like I need to start pedaling like Fred Flintstone in order to squeeze out another 0.51 miles per gallon? The current average gas price in Miami is around $2.35 per gallon, but over the course of my tracking I've been spending closer to $2.64 per gallon. So my savings would be:

0.51 miles per gallon * $2.64 per gallon * 1.56 savings per week = $2.10 per week

Is it worth ~$2 a week, or ~$104 a year, for a worse driving experience? Considering that I'm driving almost 100 miles round trip each day, 5 days a week, I think I'll leave eco mode OFF going forward.

Saturday, October 6, 2018

The Impact of the New 14-Second Shot Clock Off of Offensive Rebounds

Arguably the biggest rule change this offseason in the NBA is the implementation of the 14-second shot clock off of offensive rebounds:
A team grabbing the rebound of its own missed shot has been given the full shot clock. Under the new rule — in effect in the NBA G League since 2016-17 and international basketball since 2014-15 — the clock will go to 14 after an offensive rebound of a missed shot or free throw that hit the rim.
The rule change aims to speed up the pace of play (especially in late game situations), but how many plays will it really affect? Through BigDataBall I acquired 7 seasons of NBA play-by-play data (from 2010-11 to 2016-17, graciously hosted on a coworker's Raspberry PI in a PostgreSQL database) and looked at all possessions that resulted from an offensive rebound in the regular season. It won't affect many of them:


95.2% of all possessions off of an offensive board finish in 14 seconds of less already, even with a full 24 second shot clock. But what happens in those possessions?


For the shorter possessions, it's not surprising that teams are getting quality looks and making them more often than not (usually on a putback). But for the possessions that drag on, the quality of basketball is clearly worse. Missed shots + fouls + turnovers make up 57.9% of the short possessions, but happen 65.2% of the time when they stretch beyond 14 seconds.

What about the late game situations where the game is close? I also looked at all possessions that occurred with < 1 minute left and the score within 6 points:


93.6% of these possessions finish in 14 seconds or left, which is a slight decrease from the rest of the game. However, this specific situation only occurs over 1.7% of all plays off an offensive board (3,158 out of 180,830). That being said, fouls do occur more often, as you would expect:


Teams foul 16.6% of the time here, compared to 12.7% on all possessions. So in close end game situations with a shorter shot clock, will the trailing team foul less since they can get the ball back 10 seconds earlier? A missed shot is already the most likely outcome, so this behavior should be even more incentivized now. The 2018-19 season should bear this out, but you probably won't notice an impact on most games.

Friday, September 21, 2018

Le'Veon Bell is Costing Fantasy Owners More Than His Salary

Le'Veon Bell is currently giving up $853k a week to hold out for a better deal from either the Steelers or another team in free agency next season. That's a lot of money, and with the stalemate growing more contentious and extending past Week 3 at this point, it seems likely he will remain out until Week 11, "when he must report in order to ultimately reach free agency" (per the Washington Post).

Le'Veon Bell is also currently one of the best fantasy football players in the game. He was a consensus top 3 pick until the contract situation really started threatening his likelihood to play, after which he started sliding down draft boards:


With fantasy sports being a $7 billion industry, his holdout on the field is certainly impacting real money off the field. So I was posed this question: is Bell costing his fantasy owners more money than he is himself?

The first step towards answering this is determining how much money is really on the table in traditional fantasy football leagues. I compiled a litany of overall stats on the fantasy industry from the Fantasy Sports Trade Association:

  • 59.3 million users play fantasy sports (note that 1 person can play multiple sports)
  • 19 million users play fantasy football (32% of all users)
  • $184 is the average amount spent annually on "traditional fantasy sports", i.e. non-DFS
  • 70% of players pay a league fee
From the above figures I was able to derive a lot, along with some other assumptions. The median football league contains 12 players (the average should be slightly higher due to larger leagues skewing the mean), so I estimate there are about 1.36 million fantasy football leagues out there. Of these, 70% have a league fee, so there are 950k (1.36m * .7) paid leagues.

If the average spend is $184 per player, and 32% of players are playing football, then I'm assuming $59 ($184 * .32) is the average spend on fantasy football leagues. This may seem high since most leagues are a $20 buy-in, but this number will be skewed higher by high rollers playing in leagues that have buy-ins of $1,000+.

This means that the typical league pot is $707 ($59 * 12), resulting in $672.1 million ($707 * 950k paid leagues) being in play across all leagues. But how much is Bell's absence directly costing fantasy players? I'll need to calculate the impact in expected winnings on a team that drafted Bell with a top 3 pick, but has to use a replacement level "third best" RB instead (since 2 running backs start in a typical 12 team PPR league).

First, the expected value of a team in the playoffs: in a 12 team league, I'm assuming 4 teams make the playoffs, and are evenly matched at that point such that each team has a 25% chance to come in 1st/2nd/3rd/4th. A typical payout structure is 60%/30%/10% for 1st/2nd/3rd, so the $707 pot would be split $424/$212/$71. If each spot is equally likely (once you're in the playoffs), the expected value of winnings is $177 ($424 * .25 + $212 * .25 + $71 * .25).

Now I need to simulate the difference between a team without Bell (and a third string replacement) versus an "average" team, and how that affects their chances of making the playoffs.

Over the past two seasons, Bell has been the best running back in fantasy, averaging 22.6 points per game. Meanwhile, the replacement level third string RB taken much later (the 40th ranked RB or so) only will score around 5.3 points per game. That results in a delta of 17.3 points per game, which is a massive gulf to fill. The difference between a 50th percentile team and a 25th percentile team is only 16 points per game! So if you were average with Bell, you would drop to the 23.3 percentile without him. In turn, your odds of winning each week drop by a ton, to around 25%:


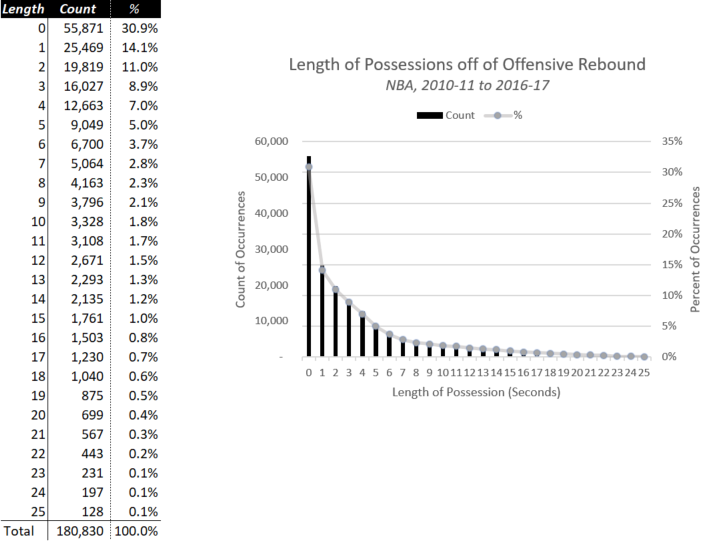
So I simulated two different seasons 10,000 times each: one in which Bell is AWOL for the first 10 weeks of the season, and one in which you (and everyone else) each have an average team all year long. You need at minimum 8 wins to make the playoffs, and you can only expect around 4 without Bell:


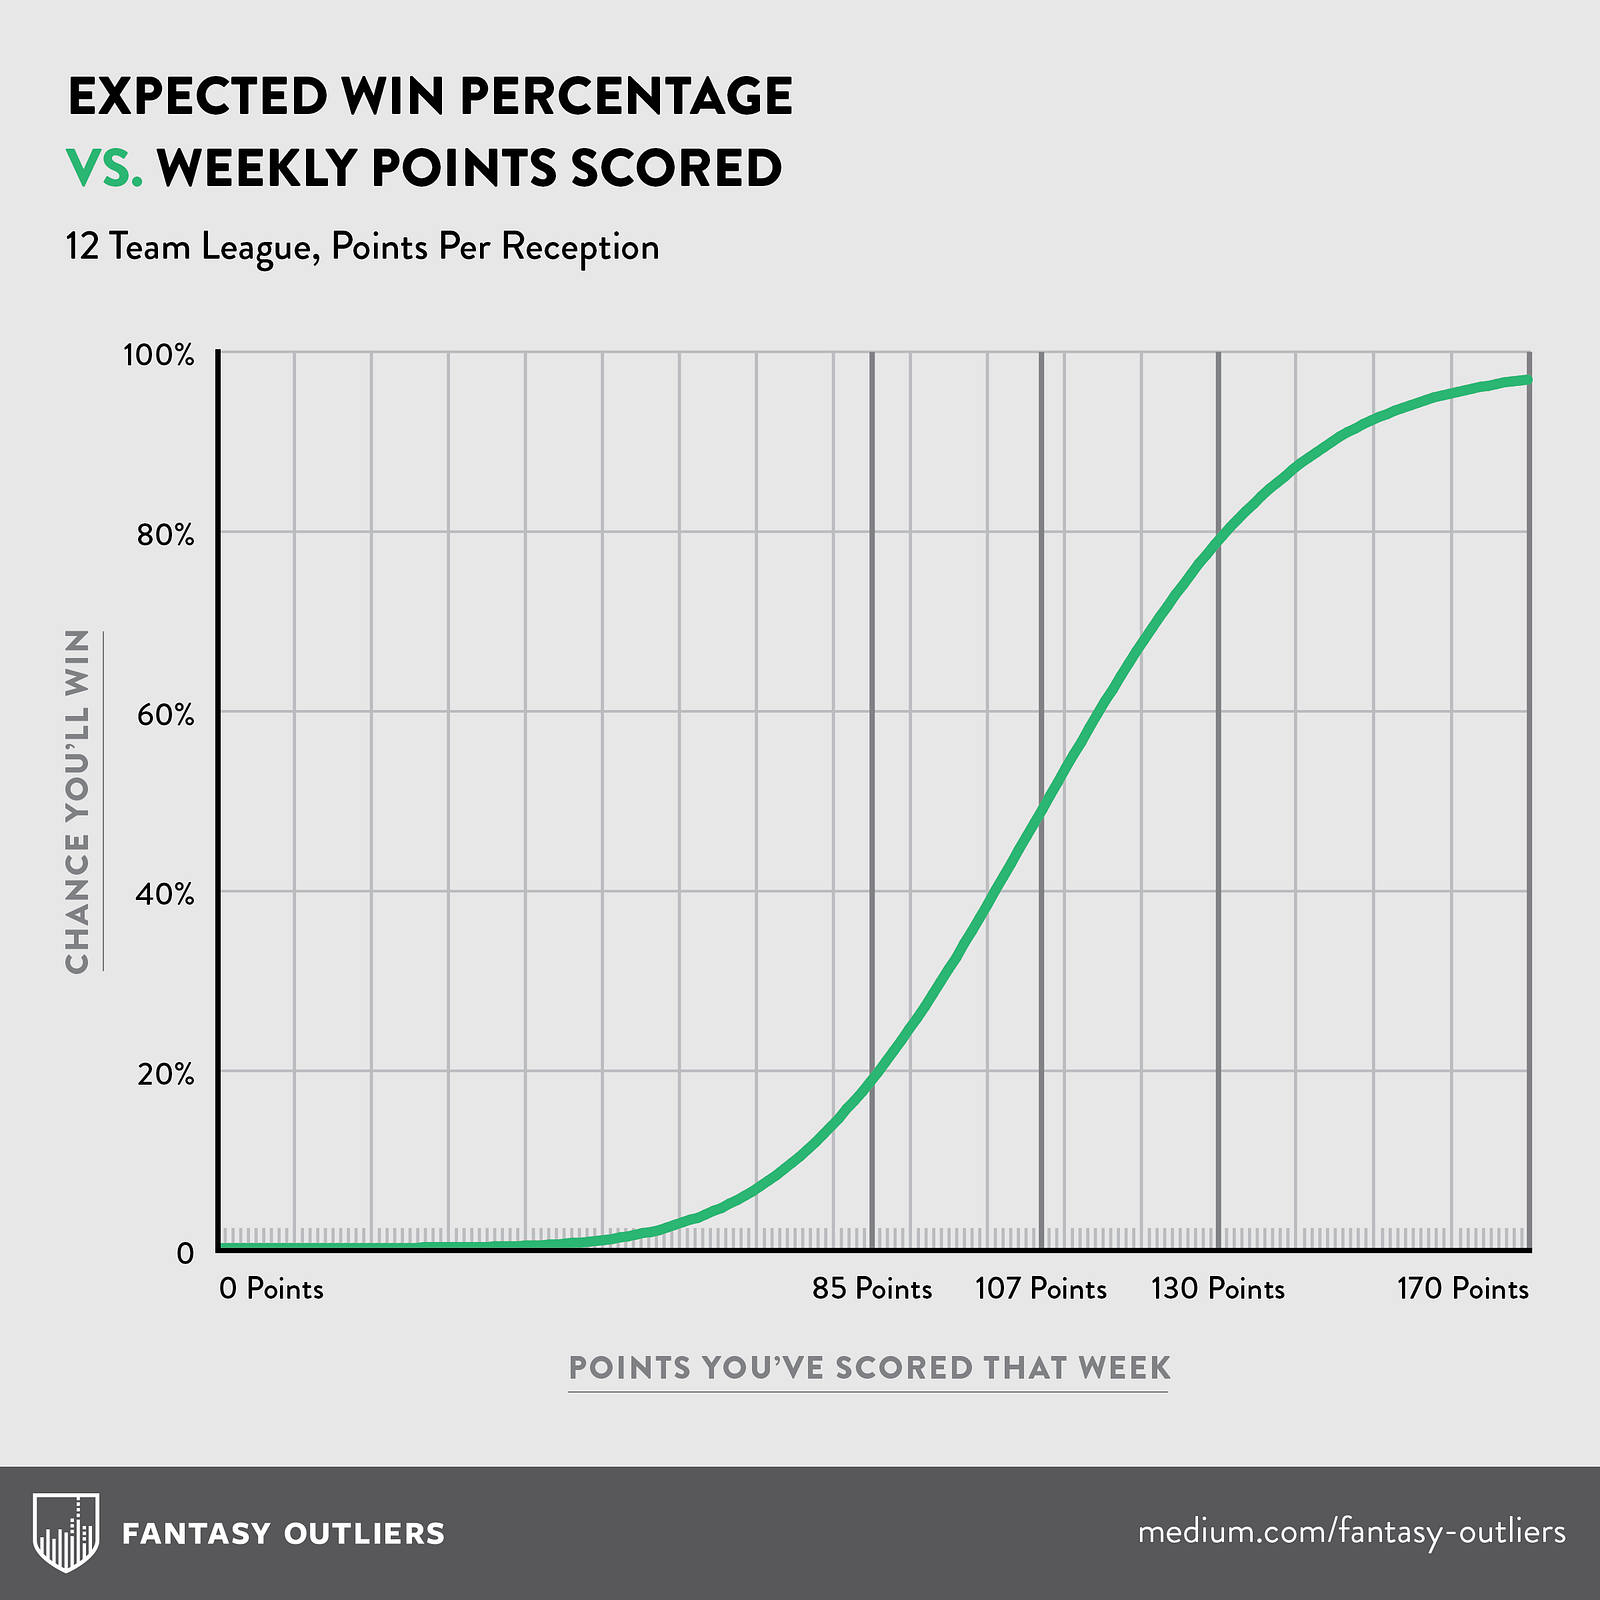
In the Bell-less scenario, you would be missing out on 17.3 points for the first 9 weeks of the season, and your chances of making the playoffs are 3.9% per the simulationsNow compare this to an "average" league with your "average" team - you should have a 4/12 chance (33.3%) of making the playoffs, and the simulations more or less back this up, projecting a 31.9% chance your "average" team makes the playoffs.

The final piece here is how much money this drop in playoff odds is costing you. The sum in expected values once in the playoffs is $168 million (950k leagues * $177 expected value in playoffs). Without Bell and a 3.9% chance of making the playoffs, the total expected value is $6.55 million (0.039 * $168 million). With Bell and a 31.9% chance of making the playoffs, the total expected value of an average team is $53.6 million. The difference between those two? $47.05 million, or $4.705 million per week that Bell misses, which completely dwarfs the $853k that Bell is foregoing each week he doesn't play.

Thursday, September 13, 2018

"What are the odds?" If Someone Has Been Married and Divorced 3 Times, that a 4th Marriage Lasts?

I received this question from an anonymous source: if someone has been married and divorced 3 times already, what are the chances that a 4th marriage for that person is successful?

The first parameter to define here is what constitutes "success" in a marriage, which presumably is not getting divorced at some point. And this may be morbid, but that means "success" is defined as when one partner dies.

Reliable statistics on the divorce rate are hard to come by since there isn't agreement on using the crude divorce rate (the number of divorces for every 1,000 people in the population) or the refined divorce rate (the number of divorces for every 1,000 married women). For my purposes I'll use the refined divorce rate, since I'm interested in whether someone is already married will get divorced.

The only divorce rates I found broken down by first/second/third marriage have no citation, but it appears to be around 41% of first marriages, 60% of second marriages, and 73% of third marriages end in divorce. There are a variety of suggested reasons for this, but multiple marriages certainly is correlated with a higher divorce rate. Even still, 3.1% of males and 3.2% of females have been married 3+ times, so this scenario is already an unlikely one.

Using these numbers and a logarithmic model, the probability of a 4th marriage ending in divorce should be around 83.61% (16.39% chance of success):


But that's not the best proxy, since as you go through more marriages, you also get older. The U.S. Census has a lot of data on the median duration of each marriage and the duration between each. Of course, the CDC also calculates the life expectancy of different demographic groups. Combining these two sources can give us a good estimate to guess "the odds that a 4th marriage is successful".

Data on first marriages shows that the median age to get married for the first time is 28.3 for males and 25.8 for females. The census data indicates that the median duration of a marriage is 8 years, and upon divorce, the time until getting remarried is about 3.75 years. Which results in the following timelines:

Age AtMaleFemale
First28.325.8
Second36.333.8
Third48.145.6
Fourth59.857.3

According to the CDC, the current life expectancy is 71.8 for males and 78.8 for females. This leaves a much shorter timeline (12 years) for men from the expected time of the 4th marriage to their life expectancy, compared to women (21.5 years).

I then used the available sample data to figure out the standard deviation in marriage lengths, which is around 14.08 years. Using an exponential distribution (which is memoryless, so the elapsed length of the marriage does not influence the likelihood of another divorce) gives the estimated probabilities that a male and female do not get divorced from the 4th marriage over a period of 12 and 21.5 years, respectively: 22.31% for the male and 6.81% for the female.

Saturday, August 25, 2018

"What are the odds?" You Have the Same Taxi Driver Twice

Let's say you're traveling to a major city, and decide to use taxis the entire time you're there (declining both public transit and Uber/Lyft). At minimum, there are thousands of taxi drivers in all major cities in the US, as well as around the world. So what are the odds that you encounter the same taxi driver twice during your trip?

For our first example, let's use New York City. Let's assume that you're spending a full week (7 days) in the city, and you take 4 taxi trips per day, or 28 trips in total. There are 13,587 medallions in existence, which results in a very unlikely scenario you'll have the same driver twice (assuming that the chances of seeing any given driver is equal, which isn't reflective of reality since drivers aren't evenly distributed throughout a city, but we'll roll with this assumption for ease of calculation).

This actually is analogous to the birthday paradox. In a room of 23 people, there's a 50/50 chance of two people having the same birthday. That's because there are 253 different possible combinations of birthdays within those 23 people, and the chance of 2 people NOT sharing a birthday is 364/365. But multiply that out 253 times and you get (364/365)^253, or 49.95%. The chances that at least one of those pairs match is 1 - 49.95%, or 50.05%.

We can use a similar formula to determine the likelihood that you end up with the same taxi driver again:


n is the number of trips (think of them as pairs of trips) and in this case the probability of NOT finding a match would be (# of drivers - 1) / # of drivers. In the New York example, that's 13586/13587. Over 28 rides, you get: 1 - (13586/13587)^((28(28-1))/2) = 2.74%

How many rides would you need to take to get the chances to 50/50? The square root of n is approximately the number of rides you would need to take to get even odds of a match, although it undershoots it a little bit. For NY, you would need 138 rides to get to there, or 35 days at 4 rides/day.


CityCountry# Taxi Drivers# DaysTrips/DayTotal TripsProb Same Driver# of Trips to Expect Repeat
San FranciscoUSA1,825742818.71%51
HoustonUSA2,245742815.50%56
Los AngelesUSA2,300742815.16%57
Washington DCUSA6,30074285.82%94
ChicagoUSA6,65074285.53%97
New York CityUSA13,58774282.74%138

As with my previous post about a doctor on an airplane, the chances entirely depend upon the number of drivers in the city. The less drivers, the more likely you see one twice.

What about around the world? This thought problem goes to the absolute extreme in Mexico City, which has one of the largest taxi fleets in the world with 140,000 taxis!


CityCountry# Taxi Drivers# DaysTrips/DayTotal TripsProb Same Driver# of Trips to Expect Repeat
TorontoCanada4,84974287.50%83
TokyoJapan35,00074281.07%222
BogotaColombia53,00074280.71%273
BeijingChina68,50074280.55%310
LondonEngland138,95774280.27%442
Mexico CityMexico140,00074280.27%443