My dad suggested that I investigate the link between the number of men left on base (per game) and offensive performance in baseball. Conventional wisdom suggests that this should be a negative correlation: the more men a team leaves on base, the lower their offense's output should be. Thus, we hypothesized that more men left on base --> less offensive output --> lower winning percentage.
I checked the correlation between men left on base (per game) and win percentage for the past 7 years (as far back as the data went from Teamrankings). It turns out this correlation is slightly positive: 0.181, meaning that the more men were left on base, the better the team performed (slightly). I then took this a step further and checked the correlation between men left on base in scoring position (per game) and win percentage. It also was slightly positive: 0.127. This contradicts my dad and I's hypothesis: but it also logically makes sense. The more men are left on base, the more men are getting on base: and thus the more runs are being scored by the team. In fact, the 2007 World Series champion Red Sox, 2008 ALCS Red Sox, 2009 World Series champion Yankees, 2010 ALCS Yankees, 2012 NLCS Cardinals, and 2013 ALCS Tigers all led the league in men left on base per game.
It turns out this study was already done in greater detail by Baseball Prospectus. They used a much larger sample size (1971 to 2007) and found the same thing: runners left on base correlates strongly with times on base (0.72), and times on base correlates very strongly with runs scored (0.91), which leads runners left on base to positively correlate with runs scored (0.52).
Thursday, May 22, 2014
Tuesday, May 20, 2014
Is NFL Preseason Success Correlated with the Regular Season?
In XLVII, the Seattle Seahawks beat down the Denver Broncos by 35. The same had happened in the preseason (in Seattle), where the Seahawks won by 30. It's conventional wisdom that preseason games have very little bearing on how a team will perform in the regular season. So, I sought to see if results in preseason games were actually repeated by the same matchups in the regular season.
However, when I looked at data from the 2013 season, of the 65 preseason matchups, only 7 were repeated in the regular season (this is probably on purpose). Due to this, this hypothesis really can't be tested and is irrelevant (in those 7 matchups, 3 preseason results matched those of the regular season (so 4 went the opposite way)).
I still figured I would see if there was any correlation between a team's preseason win percentage and their performance in the regular season. The correlation for the 2013 season was 0.322: fairly weak. Since I can't really test my hypothesis, the project isn't really worth pursuing with more data. It seems it is true: preseason NFL games don't really matter. (Anecdotal evidence: the Washington Redskins went 4-0 in the preseason and then had the 2nd worst record in the regular season).
Monday, May 19, 2014
Using Hits in a Team's Pythagorean Expectation
Pythagorean Expectation was created by Bill James to estimate a team's more "true" win percentage based on their runs scored and runs allowed. It is calculated as follows:

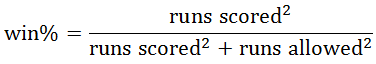
The exponents have been tweaked slightly since James originally derived this formula (I use 1.83 for MLB as opposed to 2), and can also be altered to fit other sports.
So runs scored and runs allowed are used to give a more accurate representation of wins and losses, which can then be used to calculate win percentage. My hypothesis was to take this a level deeper: use hits scored and hits allowed to estimate runs scored and runs allowed to represent wins and losses which then can be used to give win percentage.
Sunday, May 18, 2014
Revisiting STFC and Picking NCAAB ATS
As I wrote last year, if you had simply followed the crowd of Streak for the Cash in picking college basketball against the spread, you would have made a decent return, winning above the break-even threshold of 52.38%. I wanted to revisit this idea with a full season worth of data, since the best model only picked ATS winners correctly 50.93% of the time for the 2013-14 season.
I simply found regression to the mean. For the entire NCAAB season on STFC, the consensus went 116-152: 43.28%. In fact, if you had faded (gone against) these picks, you would've won 56.72% of your picks, netting a 8.28% return.
But in last season's analysis, I only took into account January 1 to the end of the season. For the 2013-14 season (from January 1-on), the trend was still reversed: 79-109, 42.02%. Again, fading these picks would've won 57.98% of the time, for a 10.69% return.
Will next year's STFC consensus picks beat Vegas or will fading those picks be the winning strategy? Your guess is as good as mine. I'm sticking with my math.
Thursday, May 15, 2014
The effects of “market size” on team performance in the NBA, NFL, and MLB
For my semester research project in ECON 570H (Econometrics) at UNC, I analyzed "the effects of “market size” on team performance in the three major North American professional sports leagues (NBA, NFL, and MLB)".
Here are my findings.
Here are my findings.
Wednesday, May 14, 2014
The FIFA Strategy of High Volume Shooting: Does It Work in the World Cup?
So called "video game strategies" revolve around high octane offenses that are designed to generate scoring. Applying these strategies to real life has been demonstrated in both football and basketball, including whether teams go for it on 4th down enough in the NFL, and utilizing efficient scoring in the NBA (shooting threes and layups).
Ultimately my question was whether my "shoot enough times and eventually you'll score" FIFA strategy holds up at the highest level: the World Cup. I analyzed all games from 2002, 2006, and 2010, and then generated a TOBIT censored regression model (with standard errors clustered by year) that uses Shots and Shots on Goal to predict the number of goals scored by each team. The model was as follows:
Ultimately my question was whether my "shoot enough times and eventually you'll score" FIFA strategy holds up at the highest level: the World Cup. I analyzed all games from 2002, 2006, and 2010, and then generated a TOBIT censored regression model (with standard errors clustered by year) that uses Shots and Shots on Goal to predict the number of goals scored by each team. The model was as follows:
Goals = -.6120012 + -.0535694*Shots + .3903682*Shots_on_Goal
Both effects were statistically significant, and these coefficients indicate that shots on goal has the larger impact on how many goals are scored. This makes sense since shots on goal are higher quality chances.
The average number of shots on goal for a team in these three World Cups was 5.3, and ranged from 0 to 15. So, I was interested in looking at only the upper end of this range: teams that took 9 or more shots on goal.
In the 192 games played involving 384 teams, only 49 teams attempted 9+ shots on goal. Within this group, only 12 of them had a positive residual: i.e. they scored more than would be expected by the above model. The other 37 teams scored less than expected, and on average, teams that had 9+ shots on goal scored 0.09 goals less per match than the model predicts.
This offers the conclusion that high volume shooting does not generate more goals; rather, quality chances are more indicative of success, and teams that "park the bus" and are defensive-oriented (like Italy) have more success than their high-shooting counterparts.
Friday, May 9, 2014
Predicting Lines (Against the Spread)
The MDS Model is essentially a strength of opponent-adjusted Pythagorean expectation for each team. Thus, each team's rating is designed to estimate "true win percentage" and is bounded by [0, 1], which allows for it to be used to predict matchup win probabilities by Log5.
However, Log5 only gives the probability of Team A beating Team B (and inversely, Team B beating Team A). A major use of modeling sports is for picking games "against the spread", which is considerably harder than picking "straight up" winners: lines (i.e. spreads) are designed to be 50/50 - having even money on each side - and the best professional gamblers in the world win only 55% of these picks.
However, Log5 only gives the probability of Team A beating Team B (and inversely, Team B beating Team A). A major use of modeling sports is for picking games "against the spread", which is considerably harder than picking "straight up" winners: lines (i.e. spreads) are designed to be 50/50 - having even money on each side - and the best professional gamblers in the world win only 55% of these picks.
Subscribe to:
Posts (Atom)